Most writing about bot traffic is either a vendor pitch or a war story from a site large enough to be attacked on purpose. This is neither. It is one small agency site, one Cloudflare account, and the numbers we found when we finally looked properly.
The short version: 72.4% of requests to our site over 23 hours carried no recognisable browser user agent. Chrome accounted for 19.7%. Every named search crawler together, Googlebot and Bingbot and Applebot, accounted for 3.5%.
That last number is the one that reorganised our thinking. Almost every argument you read about crawler management is about the named minority, and the named minority is a rounding error next to everything else knocking on the door.
How much of a small site’s traffic is bots
All figures come from Cloudflare’s GraphQL analytics for our own zone, over a 23-hour window in August 2026. Nothing here is modelled or extrapolated.
| Client | Requests | Share |
|---|---|---|
| Unrecognised | 42 700 | 72.4% |
| Chrome | 11 628 | 19.7% |
| Bingbot | 1 523 | 2.6% |
| Edge | 1 064 | 1.8% |
| Firefox | 523 | 0.9% |
| Googlebot | 362 | 0.6% |
| Chrome Mobile | 318 | 0.5% |
| Safari | 301 | 0.5% |
| Applebot | 172 | 0.3% |
| curl | 118 | 0.2% |
Across two full days the ratio of requests to unique visitors sat at 6.5 and 6.6. A human reading two or three pages does not generate six and a half requests once assets are excluded, which is the same story from a different angle.
We had seen an extreme version of this earlier in the month. On one day requests tripled to 173 093 while unique visitors stayed flat at 7 527. Tripled requests with a flat audience is not growth, it is a sweep, and the path distribution confirmed it: the most-hit single URL took only 677 requests out of that total. Something walked the whole corpus.
For comparison with a large site, the Wikimedia Foundation repeated its 2025 figures on 5 October 2026, in a post by Selena Deckelmann: bot activity had pushed its bandwidth use up 50%, and 65% of its most resource-consuming traffic came from bots. Agents the foundation believes are operated by OpenAI made millions of automated API requests and hundreds of thousands of Wikidata Query Service queries, traffic that may have contributed to a partial WDQS outage in May. None of the approvals Wikipedia requires from bots were sought, and the foundation found no evidence that its systems or data were compromised. Our 23-hour window shows the same kind of traffic on a small zone, and at Wikimedia’s scale it turns into server costs and outages.
What counts as bot traffic
We can prove those clients do not present as browsers. We cannot prove what they are, and neither can anyone else running the same query.
That category contains uptime monitors we pay for, link checkers, HTTP libraries in someone’s script, security scanners, feed readers, AI crawlers building training sets, and agents fetching a page on behalf of a person who asked a question. Some of that traffic is useful to us. Some of it is indifferent. A little of it is hostile.
So the honest headline is not “72% of our traffic is bots attacking us”. It is 72% of our traffic does not run a browser, and that distinction changes what you should do about it.
Does robots.txt reduce server load
We went looking for a robots.txt problem first, because that is the cheapest thing to check and a genuinely common defect: robots.txt is served per protocol and per subdomain, so http, www and the apex can quietly disagree with each other. Ours were identical, byte for byte, all redirecting to one canonical address.
Worth saying plainly, because a clean result is a result. If we had published only what we fixed, you would get a distorted picture of how much of this work finds anything.
The other thing worth stating: robots.txt does not reduce load. It is a request for cooperation from clients that read it. Everything that ignores it still arrives at your server and still consumes whatever runs on the request path. The layers that actually reduce load are the ones evaluated before your application code runs. If analytics rather than server load is your problem, filtering bots out of the reports is a different job with a different fix, and we wrote that one up separately in how to block bot traffic in WordPress analytics. This post is about what reaches the server, which is the layer a WordPress developer has to design for.
Why Cloudflare does not cache HTML pages
While pulling these numbers we noticed the edge cache hit ratio: about 4%, on a site where every page is prerendered at build time. That should be near the opposite.
Every page sends this:
cache-control: public, max-age=60, s-maxage=3600, stale-while-revalidate=86400And every page came back cf-cache-status: DYNAMIC. We were asking for an hour of edge caching and had never once received it.
Two causes, and only together do they explain it.
Cloudflare does not cache HTML by default. The default cache level covers a list of static extensions, and HTML is not on it, regardless of what your origin says. Sending s-maxage does not make HTML cacheable; a cache rule does.
Our own feature blocked the rest. We serve a Markdown representation of every page to agents that ask for it with Accept: text/markdown. That means one URL has two representations. For a cache to be safe, the cache key must include Accept, and Cloudflare’s standard cache key includes only Vary: Accept-Encoding. Turning caching on naively would eventually hand an agent a cached HTML page, or hand a person cached Markdown, which is worse than no cache at all.
This is the part worth generalising: the cost was invisible because it belonged to a feature we were proud of. Nobody audits the price of their own good idea.
The fix was a cache rule conditioned on the request header: cache pages, but only when Accept does not ask for Markdown. Then the cache key never needs to carry Accept, because the negotiating requests are excluded from caching entirely. They are about a hundred a day against tens of thousands of ordinary page views.
It ships with a second half that is not optional: purge the cache on deploy. Without it, every deploy leaves up to an hour of stale pages for part of the audience, and the next thing you hear is that a change is not visible. A caching rule without a purge step is a trap you set for yourself.
Does edge caching help with crawler traffic spikes
With max-age=60, edge caching changes little for a returning human. What it changes is what happens when something sweeps your whole site.
Our pages run through an edge function on every HTML request, and the free tier allows 100 000 function invocations a day. The median day sits near 30 000. On the day of that sweep it reached 131 255, which is past the ceiling.
So the cache was never a performance nicety. It was the difference between a crawl being invisible and a crawl taking the site down. That reframing only became available once the bot share and the cache ratio were on the same page.
Why does a 301 redirect on an MCP endpoint break POST requests
We keep a separate counter for the machine-readable surface, because browser analytics cannot see it: an agent fetching a JSON file runs no JavaScript, so a beacon-based analytics tool reports nothing at all.
That counter says about 102 agent requests a day. The distribution surprised us: two thirds go to our MCP endpoint, not to the declarative cards like agent.json or llms.txt that get all the attention in the AI-visibility conversation.
Then it told us something worse. The address without a trailing slash was answering 301. A redirect turns a POST into a GET and drops the request body, so a JSON-RPC client either receives nothing or receives a parse error. Measured over a day: 29 broken calls against 2 that worked.
We had a public endpoint for agents that was, for a large share of clients, simply broken, and we would not have known. It appears in no dashboard a marketer looks at. It generated no error anyone saw, because the people it failed were not people.
Three attempts to fix it in the application failed, because the platform’s trailing-slash normalisation happens before application code runs. The fix had to sit above the cause, as a rewrite rule at the network edge. The day after: 12 successful POST responses where there had been none.
Which redirect status keeps a POST request intact
The HTTP standard explains why the 301 hurt. RFC 9110, section 15.4.2 notes that, for historical reasons, a client following a 301 may change the method from POST to GET, and names 308 Permanent Redirect as the code to use when that is not acceptable. The same note appears under 302, pointing to 307 instead.
For 307 Temporary Redirect the rule is strict: the client must not change the request method when it follows the redirect automatically (section 15.4.8). The standard also warns that 308 is much younger than its siblings, defined in June 2014, and might not be recognised everywhere (section 15.4.9).
For a JSON-RPC endpoint that leaves two options. A 308 depends on every client implementing it and sending the body again. An internal rewrite returns no redirect at all, so the client has nothing to decide. Our edge fix is exactly such a rewrite, so this question never reaches the client.
How to measure bot traffic with Cloudflare GraphQL
Nothing here needed a paid tool. Cloudflare’s GraphQL analytics endpoint answers all of it, and the whole exercise is one API token and a handful of queries.
Two traps cost us time, so they are worth naming.
The token permission is not the obvious one. Our long-standing API token could deploy, purge and manage rules, and returned a permissions error on every analytics query. Analytics needs Zone / Analytics / Read specifically, and a token can be perfectly capable of changing your site while being unable to tell you anything about it. Worse, an account-scoped token can fail the usual /user/tokens/verify check while working correctly for GraphQL, so test it with a real query rather than the verification endpoint.
The time window is capped. On our plan the adaptive request dataset refuses any query spanning more than one day and keeps roughly three days of history. Ask for thirty days and you do not get a partial answer, you get an error. Loop day by day and aggregate client side.
The query shape that produced the user-agent table is small:
{ viewer { zones(filter: {zoneTag: "YOUR_ZONE_ID"}) {
    httpRequestsAdaptiveGroups(
      limit: 12,
      filter: {datetime_geq: "2026-08-19T15:00:00Z"},
      orderBy: [count_DESC]
    ) { count dimensions { userAgentBrowser } }
} } }
Swap userAgentBrowser for cacheStatus, edgeResponseStatus, clientRequestPath or clientCountryName and you have the rest of the picture. For requests against unique visitors, httpRequests1dGroups carries both in one row.
One caveat that matters when you read your own output: userAgentBrowser is Cloudflare’s classification, not ground truth. “Unrecognised” means their parser did not match a known browser signature. A crawler that sends a Chrome user agent string is counted as Chrome, so the true non-browser share is a floor, not a ceiling.
Should you block bot traffic
The obvious next move after finding 72% is to start blocking. We did not, and the reasoning is worth more than the decision.
We did not add WAF rules or rate limiting. Both would work, and both sit at the right layer, before application code. But we had no evidence of harm. Nothing was down, nothing was slow for humans, and no cost was being paid that a cache rule could not remove more cheaply. Blocking traffic you have not shown to be harmful trades a real risk, locking out something you depend on, against a hypothetical one.
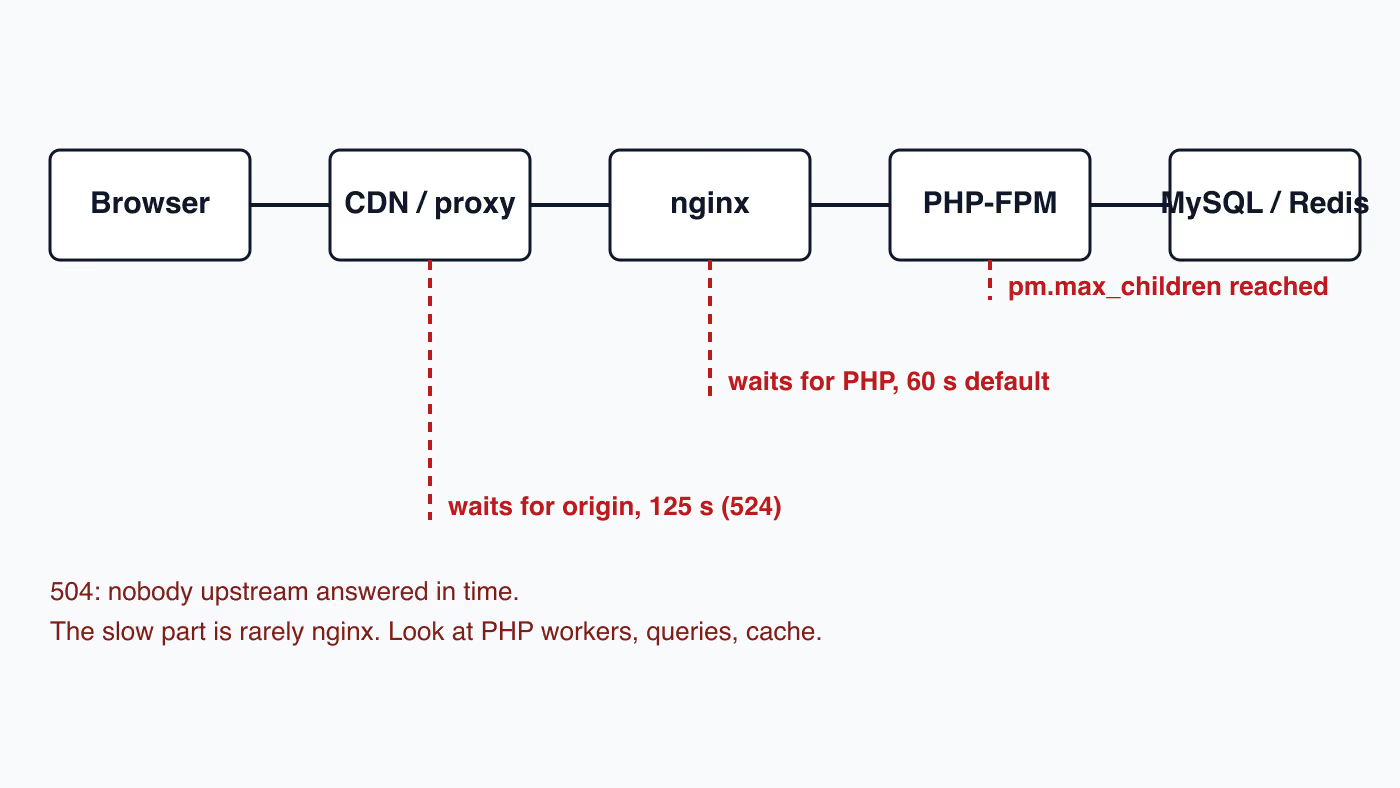
We did not chase an error that was fixing itself. Partway through this work we found 9 956 gateway timeouts in a day, spread across the whole site including contact pages in every language. It looked like an emergency. Then the breakdown showed every single one carried an unrecognised user agent: zero from Chrome, Safari, Googlebot or Bingbot. No human and no search engine ever saw one. We wrote it down and left it alone. A day later the same window showed three. Had we “fixed” it, we would have been fixing somebody else’s crawler and shipping a change to our own codebase that healed nothing.
We did not fund the expensive agent work. The same counter that found the broken endpoint also priced a backlog for us. Signed identity documents, third-party attestations, a sandbox, a machine-readable contract: each is weeks of work, and each is justified by an assumption that buying agents read our declarative files. At 26 requests a day to agent.json, that assumption does not survive contact with the counter. Two independent measurements a day apart agreed, so the decision now rests on measurement rather than on one reading.
The pattern in all three is the same. Measurement earns the right to do nothing, which is a use of data that gets far less credit than it deserves. Most of the value we got from this exercise was not the two fixes. It was knowing which of the alarming numbers deserved our week.
Bot traffic checklist for a small website
Measure before you block anything. Pull the user-agent breakdown for a full day. Ratio of requests to unique visitors is the fastest sanity check, and if it is far above two or three, look closer.
Check your cache status, not your cache headers. cache-control is a request. cf-cache-status, or your CDN’s equivalent, is the answer. We spent a long time believing a header that had never once taken effect.
Count the traffic your analytics cannot see. If your visibility to AI agents matters to you at all, the only place that traffic appears is server or edge logs. Ours revealed a broken endpoint that had been failing quietly for weeks.
Be careful what you call an attack. Most of what we found was neither malicious nor useful. It was indifferent. The useful response to indifferent traffic is to make it cheap to serve, not to fight it.
Audit the cost of your own features. The most expensive thing we found was not a bot. It was a feature we built deliberately, priced at zero, that had been costing us our entire HTML edge cache.
Indifferent bot load is also why we keep EU compliance audits for WordPress separate from vanity traffic charts: the control plane and the analytics story are not the same work.